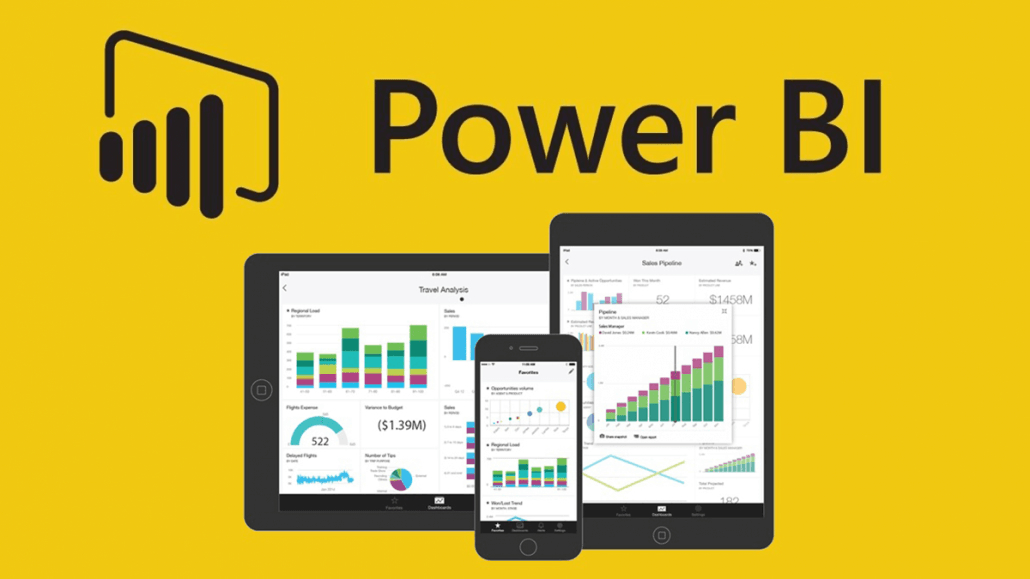
Power BI Visualization and Reporting

About Course
Desired Outcome:
Upon completing this course, students will be proficient in creating compelling data visualizations, interactive reports, and dashboards using Microsoft Power BI. They will have the skills to transform raw data into actionable insights for decision-making.
Course Content
Module 1: Introduction to Power BI and Installation
-
Power BI Overview and Benefits
00:00 -
Download and Installation of Power BI Desktop
00:00
Module 2: Data Transformation and Modeling in Power BI
Module 3: DAX Formulas and Functions Mastery
Module 4: Advanced Data Visualizations
Module 5: Power BI Service and Collaboration
Module 6: Power BI Security and Governance
Module 7: Advanced Analytics and Insights
Module 8: Real-world Project: Power BI Dashboard Development
Quizzes, Assignments, and Assessments
Student Ratings & Reviews

No Review Yet
